tsfresh.feature_extraction package
Submodules
tsfresh.feature_extraction.data module
- class tsfresh.feature_extraction.data.DaskTsAdapter(df, column_id, column_kind=None, column_value=None, column_sort=None)[source]
Bases:
TsData
- class tsfresh.feature_extraction.data.LongTsFrameAdapter(df, column_id, column_kind, column_value=None, column_sort=None)[source]
Bases:
PartitionedTsData
- class tsfresh.feature_extraction.data.PartitionedTsData(df, column_id)[source]
Bases:
Iterable[Timeseries],Sized,TsDataSpecial class of TsData, which can be partitioned. Derived classes should implement __iter__ and __len__.
- pivot(results)[source]
Helper function to turn an iterable of tuples with three entries into a dataframe.
The input
list_of_tuplesneeds to be an iterable with tuples containing three entries: (a, b, c). Out of this, a pandas dataframe will be created with all a’s as index, all b’s as columns and all c’s as values.It basically does a pd.pivot(first entry, second entry, third entry), but optimized for non-pandas input (= python list of tuples).
This function is called in the end of the extract_features call.
- class tsfresh.feature_extraction.data.Timeseries(id, kind, data)[source]
Bases:
TimeseriesTimeseries tuple used for feature extraction.
Make sure kind is of type str to allow inference of feature settings in feature_extraction.settings.from_columns.
- class tsfresh.feature_extraction.data.TsData[source]
Bases:
objectTsData provides access to time series data for internal usage.
Distributors will use this data class to apply functions on the data. All derived classes must either implement the apply method, which is used to apply the given function directly on the data or the __iter__ method, which can be used to get an iterator of Timeseries instances (which distributors can use to apply the function on). Other methods can be overwritten if a more efficient solution exists for the underlying data store.
- class tsfresh.feature_extraction.data.TsDictAdapter(ts_dict, column_id, column_value, column_sort=None)[source]
Bases:
PartitionedTsData
- class tsfresh.feature_extraction.data.WideTsFrameAdapter(df, column_id, column_sort=None, value_columns=None)[source]
Bases:
PartitionedTsData
- tsfresh.feature_extraction.data.to_tsdata(df, column_id=None, column_kind=None, column_value=None, column_sort=None)[source]
Wrap supported data formats as a TsData object, i.e. an iterable of individual time series.
E.g. the DataFrame
id
kind
val
1
a
-0.21761
1
a
-0.613667
1
a
-2.07339
2
b
-0.576254
2
b
-1.21924
into
- Iterable((1, ‘a’, pd.Series([-0.217610, -0.613667, -2.073386]),
(2, ‘b’, pd.Series([-0.576254, -1.219238]))
- Parameters:
df (pd.DataFrame|dict|TsData) – one of the supported input formats
column_id (str|None) – The name of the id column to group by.
column_kind (str|None) – The name of the column keeping record on the kind of the value.
column_value (str|None) – The name for the column keeping the value itself.
column_sort (str|None) – The name for the column to sort on.
- Returns:
a data adapter
- Return type:
tsfresh.feature_extraction.extraction module
This module contains the main function to interact with tsfresh: extract features
- tsfresh.feature_extraction.extraction.extract_features(timeseries_container, default_fc_parameters=None, kind_to_fc_parameters=None, column_id=None, column_sort=None, column_kind=None, column_value=None, chunksize=None, n_jobs=1, show_warnings=False, disable_progressbar=False, impute_function=None, profile=False, profiling_filename='profile.txt', profiling_sorting='cumulative', distributor=None, pivot=True)[source]
Extract features from
a
pandas.DataFramecontaining the different time series
or
a dictionary of
pandas.DataFrameeach containing one type of time series
In both cases a
pandas.DataFramewith the calculated features will be returned.For a list of all the calculated time series features, please see the
ComprehensiveFCParametersclass, which is used to control which features with which parameters are calculated.For a detailed explanation of the different parameters (e.g. the columns) and data formats please see Data Formats.
Examples
>>> from tsfresh.examples import load_robot_execution_failures
>>> from tsfresh import extract_features
>>> df, _ = load_robot_execution_failures()
>>> X = extract_features(df, column_id='id', column_sort='time')
- Parameters:
timeseries_container (pandas.DataFrame or dict) – The pandas.DataFrame with the time series to compute the features for, or a dictionary of pandas.DataFrames.
default_fc_parameters (dict) – mapping from feature calculator names to parameters. Only those names which are keys in this dict will be calculated. See the class:ComprehensiveFCParameters for more information.
kind_to_fc_parameters (dict) – mapping from kind names to objects of the same type as the ones for default_fc_parameters. If you put a kind as a key here, the fc_parameters object (which is the value), will be used instead of the default_fc_parameters. This means that kinds, for which kind_of_fc_parameters doe not have any entries, will be ignored by the feature selection.
column_id (str) – The name of the id column to group by. Please see Data Formats.
column_sort (str) – The name of the sort column. Please see Data Formats.
column_kind (str) – The name of the column keeping record on the kind of the value. Please see Data Formats.
column_value (str) – The name for the column keeping the value itself. Please see Data Formats.
n_jobs (int) – The number of processes to use for parallelization. If zero, no parallelization is used.
chunksize (None or int) – The size of one chunk that is submitted to the worker process for the parallelisation. Where one chunk is defined as a singular time series for one id and one kind. If you set the chunksize to 10, then it means that one task is to calculate all features for 10 time series. If it is set it to None, depending on distributor, heuristics are used to find the optimal chunksize. If you get out of memory exceptions, you can try it with the dask distributor and a smaller chunksize.
show_warnings (bool) – Show warnings during the feature extraction (needed for debugging of calculators).
disable_progressbar (bool) – Do not show a progressbar while doing the calculation.
impute_function (None or callable) – None, if no imputing should happen or the function to call for imputing the result dataframe. Imputing will never happen on the input data.
profile (bool) – Turn on profiling during feature extraction
profiling_sorting (basestring) – How to sort the profiling results (see the documentation of the profiling package for more information)
profiling_filename (basestring) – Where to save the profiling results.
distributor (class) – Advanced parameter: set this to a class name that you want to use as a distributor. See the utilities/distribution.py for more information. Leave to None, if you want TSFresh to choose the best distributor.
- Returns:
The (maybe imputed) DataFrame containing extracted features.
- Return type:
pandas.DataFrame
tsfresh.feature_extraction.feature_calculators module
This module contains the feature calculators that take time series as input and calculate the values of the feature. There are two types of features:
feature calculators which calculate a single number (simple)
feature calculators which calculate a bunch of features for a list of parameters at once, to use e.g. cached results (combiner). They return a list of (key, value) pairs for each input parameter.
They are specified using the “fctype” parameter of each feature calculator, which is added using the set_property function. Only functions in this python module, which have a parameter called “fctype” are seen by tsfresh as a feature calculator. Others will not be calculated.
Feature calculators of type combiner should return the concatenated parameters sorted alphabetically ascending.
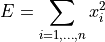
- tsfresh.feature_extraction.feature_calculators.abs_energy(x)[source]
Returns the absolute energy of the time series which is the sum over the squared values
- Parameters:
x (numpy.ndarray) – the time series to calculate the feature of
- Returns:
the value of this feature
- Return type:
float
This function is of type: simple
- tsfresh.feature_extraction.feature_calculators.absolute_maximum(x)[source]
Calculates the highest absolute value of the time series x.
- Parameters:
x (numpy.ndarray) – the time series to calculate the feature of
- Returns:
the value of this feature
- Return type:
float
This function is of type: simple
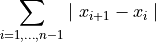
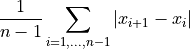
- tsfresh.feature_extraction.feature_calculators.absolute_sum_of_changes(x)[source]
Returns the sum over the absolute value of consecutive changes in the series x
- Parameters:
x (numpy.ndarray) – the time series to calculate the feature of
- Returns:
the value of this feature
- Return type:
float
This function is of type: simple
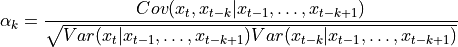
- tsfresh.feature_extraction.feature_calculators.agg_autocorrelation(x, param)[source]
Descriptive statistics on the autocorrelation of the time series.
Calculates the value of an aggregation function
 (e.g. the variance or the mean) over the
autocorrelation
(e.g. the variance or the mean) over the
autocorrelation  for different lags. The autocorrelation for lag
  is defined as
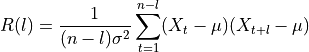
where
 are the values of the time series,
  its length. Finally,
  and
and
 are estimators for its variance and mean
(See Estimation of the Autocorrelation function).
are estimators for its variance and mean
(See Estimation of the Autocorrelation function).The
for different lags form a vector. This feature calculator applies the aggregation
function to this vector and returns
Here
 is the second parameter passed to this function.
- Parameters:
x (numpy.ndarray) – the time series to calculate the feature of
param (list) – contains dictionaries {“f_agg”: x, “maxlag”, n} with x str, the name of a numpy function (e.g. “mean”, “var”, “std”, “median”), its the name of the aggregator function that is applied to the autocorrelations. Further, n is an int and the maximal number of lags to consider.
- Returns:
the value of this feature
- Return type:
List[Tuple[str, float]]
This function is of type: combiner
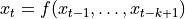
- tsfresh.feature_extraction.feature_calculators.agg_linear_trend(x, param)[source]
Calculates a linear least-squares regression for values of the time series that were aggregated over chunks versus the sequence from 0 up to the number of chunks minus one.
This feature assumes the signal to be uniformly sampled. It will not use the time stamps to fit the model.
The parameters attr controls which of the characteristics are returned. Possible extracted attributes are “pvalue”, “rvalue”, “intercept”, “slope”, “stderr”, see the documentation of linregress for more information.
The chunksize is regulated by “chunk_len”. It specifies how many time series values are in each chunk.
Further, the aggregation function is controlled by “f_agg”, which can use “max”, “min” or , “mean”, “median”
- Parameters:
x (numpy.ndarray) – the time series to calculate the feature of
param (list) – contains dictionaries {“attr”: x, “chunk_len”: l, “f_agg”: f} with x, f an string and l an int
- Returns:
the different feature values
- Return type:
Iterator[Tuple[str, float]]
This function is of type: combiner
- tsfresh.feature_extraction.feature_calculators.approximate_entropy(x, m, r)[source]
Implements a vectorized Approximate entropy algorithm.
For short time-series this method is highly dependent on the parameters, but should be stable for N > 2000, see:
Yentes et al. (2012) - The Appropriate Use of Approximate Entropy and Sample Entropy with Short Data Sets
Other shortcomings and alternatives discussed in:
Richman & Moorman (2000) - Physiological time-series analysis using approximate entropy and sample entropy
- Parameters:
x (numpy.ndarray) – the time series to calculate the feature of
m (int) – Length of compared run of data
r (float) – Filtering level, must be positive
- Returns:
Approximate entropy
- Return type:
float
This function is of type: simple
- tsfresh.feature_extraction.feature_calculators.ar_coefficient(x, param)[source]
This feature calculator fits the unconditional maximum likelihood of an autoregressive AR(k) process. The k parameter is the maximum lag of the process
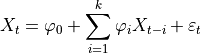
For the configurations from param which should contain the maxlag “k” and such an AR process is calculated. Then the coefficients
 whose index
  contained from “coeff” are returned.
- Parameters:
x (numpy.ndarray) – the time series to calculate the feature of
param (list) – contains dictionaries {“coeff”: x, “k”: y} with x,y int
- Return x:
the different feature values
- Return type:
List[Tuple[str, float]]
This function is of type: combiner
- tsfresh.feature_extraction.feature_calculators.augmented_dickey_fuller(x, param)[source]
Does the time series have a unit root?
The Augmented Dickey-Fuller test is a hypothesis test which checks whether a unit root is present in a time series sample. This feature calculator returns the value of the respective test statistic.
See the statsmodels implementation for references and more details.
- Parameters:
x (numpy.ndarray) – the time series to calculate the feature of
param (list) – contains dictionaries {“attr”: x, “autolag”: y} with x str, either “teststat”, “pvalue” or “usedlag” and with y str, either of “AIC”, “BIC”, “t-stats” or None (See the documentation of adfuller() in statsmodels).
- Returns:
the value of this feature
- Return type:
List[Tuple[str, float]]
This function is of type: combiner
- tsfresh.feature_extraction.feature_calculators.autocorrelation(x, lag)[source]
Calculates the autocorrelation of the specified lag, according to the formula [1]
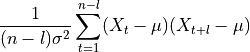
where
is the length of the time series , its variance and its
mean. l denotes the lag.References
[1] https://en.wikipedia.org/wiki/Autocorrelation#Estimation
- Parameters:
x (numpy.ndarray) – the time series to calculate the feature of
lag (int) – the lag
- Returns:
the value of this feature
- Return type:
float
This function is of type: simple
- tsfresh.feature_extraction.feature_calculators.benford_correlation(x)[source]
Useful for anomaly detection applications [1][2]. Returns the correlation from first digit distribution when compared to the Newcomb-Benford’s Law distribution [3][4].
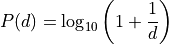
where
 is the Newcomb-Benford distribution for
  that is the leading digit of the number
{1, 2, 3, 4, 5, 6, 7, 8, 9}.
that is the leading digit of the number
{1, 2, 3, 4, 5, 6, 7, 8, 9}.References
[1] A Statistical Derivation of the Significant-Digit Law, Theodore P. Hill, Statistical Science, 1995[2] The significant-digit phenomenon, Theodore P. Hill, The American Mathematical Monthly, 1995[3] The law of anomalous numbers, Frank Benford, Proceedings of the American philosophical society, 1938[4] Note on the frequency of use of the different digits in natural numbers, Simon Newcomb, American Journal ofmathematics, 1881- Parameters:
x (numpy.ndarray) – the time series to calculate the feature of
- Returns:
the value of this feature
- Return type:
float
This function is of type: simple
- tsfresh.feature_extraction.feature_calculators.binned_entropy(x, max_bins)[source]
First bins the values of x into max_bins equidistant bins. Then calculates the value of
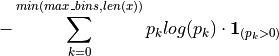
where
 is the percentage of samples in bin
  .
.- Parameters:
x (numpy.ndarray) – the time series to calculate the feature of
max_bins (int) – the maximal number of bins
- Returns:
the value of this feature
- Return type:
float
This function is of type: simple
- tsfresh.feature_extraction.feature_calculators.c3(x, lag)[source]
Uses c3 statistics to measure non linearity in the time series
This function calculates the value of
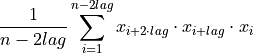
which is
![\mathbb{E}[L^2(X) \cdot L(X) \cdot X]](../_images/math/352e21198896f6a218bb7e5fb4ab4fabc89b3669.png)
where
 is the mean and
  is the lag operator. It was proposed in [1] as a measure of
non linearity in the time series.
is the lag operator. It was proposed in [1] as a measure of
non linearity in the time series.References
[1] Schreiber, T. and Schmitz, A. (1997).Discrimination power of measures for nonlinearity in a time seriesPHYSICAL REVIEW E, VOLUME 55, NUMBER 5- Parameters:
x (numpy.ndarray) – the time series to calculate the feature of
lag (int) – the lag that should be used in the calculation of the feature
- Returns:
the value of this feature
- Return type:
float
This function is of type: simple
- tsfresh.feature_extraction.feature_calculators.change_quantiles(x, ql, qh, isabs, f_agg)[source]
First fixes a corridor given by the quantiles ql and qh of the distribution of x. Then calculates the average, absolute value of consecutive changes of the series x inside this corridor.
Think about selecting a corridor on the y-Axis and only calculating the mean of the absolute change of the time series inside this corridor.
- Parameters:
x (numpy.ndarray) – the time series to calculate the feature of
ql (float) – the lower quantile of the corridor
qh (float) – the higher quantile of the corridor
isabs (bool) – should the absolute differences be taken?
f_agg (str, name of a numpy function (e.g. mean, var, std, median)) – the aggregator function that is applied to the differences in the bin
- Returns:
the value of this feature
- Return type:
float
This function is of type: simple
- tsfresh.feature_extraction.feature_calculators.cid_ce(x, normalize)[source]
This function calculator is an estimate for a time series complexity [1] (A more complex time series has more peaks, valleys etc.). It calculates the value of
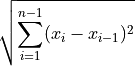
References
[1] Batista, Gustavo EAPA, et al (2014).CID: an efficient complexity-invariant distance for time series.Data Mining and Knowledge Discovery 28.3 (2014): 634-669.- Parameters:
x (numpy.ndarray) – the time series to calculate the feature of
normalize (bool) – should the time series be z-transformed?
- Returns:
the value of this feature
- Return type:
float
This function is of type: simple
- tsfresh.feature_extraction.feature_calculators.count_above(x, t)[source]
Returns the percentage of values in x that are higher than t
- Parameters:
x (pandas.Series) – the time series to calculate the feature of
t (float) – value used as threshold
- Returns:
the value of this feature
- Return type:
float
This function is of type: simple
- tsfresh.feature_extraction.feature_calculators.count_above_mean(x)[source]
Returns the number of values in x that are higher than the mean of x
- Parameters:
x (numpy.ndarray) – the time series to calculate the feature of
- Returns:
the value of this feature
- Return type:
float
This function is of type: simple
- tsfresh.feature_extraction.feature_calculators.count_below(x, t)[source]
Returns the percentage of values in x that are lower than t
- Parameters:
x (pandas.Series) – the time series to calculate the feature of
t (float) – value used as threshold
- Returns:
the value of this feature
- Return type:
float
This function is of type: simple
- tsfresh.feature_extraction.feature_calculators.count_below_mean(x)[source]
Returns the number of values in x that are lower than the mean of x
- Parameters:
x (numpy.ndarray) – the time series to calculate the feature of
- Returns:
the value of this feature
- Return type:
float
This function is of type: simple
- tsfresh.feature_extraction.feature_calculators.cwt_coefficients(x, param)[source]
Calculates a Continuous wavelet transform for the Ricker wavelet, also known as the “Mexican hat wavelet” which is defined by
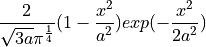
where
 is the width parameter of the wavelet function.
This feature calculator takes three different parameter: widths, coeff and w. The feature calculator takes all the different widths arrays and then calculates the cwt one time for each different width array. Then the values for the different coefficient for coeff and width w are returned. (For each dic in param one feature is returned)
- Parameters:
x (numpy.ndarray) – the time series to calculate the feature of
param (list) – contains dictionaries {“widths”:x, “coeff”: y, “w”: z} with x array of int and y,z int
- Returns:
the different feature values
- Return type:
Iterator[Tuple[str, float]]
This function is of type: combiner
- tsfresh.feature_extraction.feature_calculators.energy_ratio_by_chunks(x, param)[source]
Calculates the sum of squares of chunk i out of N chunks expressed as a ratio with the sum of squares over the whole series.
Takes as input parameters the number num_segments of segments to divide the series into and segment_focus which is the segment number (starting at zero) to return a feature on.
If the length of the time series is not a multiple of the number of segments, the remaining data points are distributed on the bins starting from the first. For example, if your time series consists of 8 entries, the first two bins will contain 3 and the last two values, e.g. [ 0., 1., 2.], [ 3., 4., 5.] and [ 6., 7.].
Note that the answer for num_segments = 1 is a trivial “1” but we handle this scenario in case somebody calls it. Sum of the ratios should be 1.0.
- Parameters:
x (numpy.ndarray) – the time series to calculate the feature of
param – contains dictionaries {“num_segments”: N, “segment_focus”: i} with N, i both ints
- Returns:
the feature values
- Return type:
List[Tuple[str, float]]
This function is of type: combiner
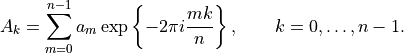
- tsfresh.feature_extraction.feature_calculators.fft_aggregated(x, param)[source]
Returns the spectral centroid (mean), variance, skew, and kurtosis of the absolute fourier transform spectrum.
- Parameters:
x (numpy.ndarray) – the time series to calculate the feature of
param (list) – contains dictionaries {“aggtype”: s} where s str and in [“centroid”, “variance”, “skew”, “kurtosis”]
- Returns:
the different feature values
- Return type:
Iterator[Tuple[str, float]]
This function is of type: combiner
- tsfresh.feature_extraction.feature_calculators.fft_coefficient(x, param)[source]
Calculates the fourier coefficients of the one-dimensional discrete Fourier Transform for real input by fast fourier transformation algorithm
The resulting coefficients will be complex, this feature calculator can return the real part (attr==”real”), the imaginary part (attr==”imag), the absolute value (attr=””abs) and the angle in degrees (attr==”angle).
- Parameters:
x (numpy.ndarray) – the time series to calculate the feature of
param (list) – contains dictionaries {“coeff”: x, “attr”: s} with x int and x >= 0, s str and in [“real”, “imag”, “abs”, “angle”]
- Returns:
the different feature values
- Return type:
Iterator[Tuple[str, float]]
This function is of type: combiner
- tsfresh.feature_extraction.feature_calculators.first_location_of_maximum(x)[source]
Returns the first location of the maximum value of x. The position is calculated relatively to the length of x.
- Parameters:
x (numpy.ndarray) – the time series to calculate the feature of
- Returns:
the value of this feature
- Return type:
float
This function is of type: simple
- tsfresh.feature_extraction.feature_calculators.first_location_of_minimum(x)[source]
Returns the first location of the minimal value of x. The position is calculated relatively to the length of x.
- Parameters:
x (numpy.ndarray) – the time series to calculate the feature of
- Returns:
the value of this feature
- Return type:
float
This function is of type: simple
- tsfresh.feature_extraction.feature_calculators.fourier_entropy(x, bins)[source]
Calculate the binned entropy of the power spectral density of the time series (using the welch method).
Ref: https://hackaday.io/project/707-complexity-of-a-time-series/details Ref: https://docs.scipy.org/doc/scipy-0.14.0/reference/generated/scipy.signal.welch.html
This function is of type: simple
- tsfresh.feature_extraction.feature_calculators.friedrich_coefficients(x, param)[source]
Coefficients of polynomial
 , which has been fitted to
the deterministic dynamics of Langevin model
, which has been fitted to
the deterministic dynamics of Langevin model
as described by [1].
For short time-series this method is highly dependent on the parameters.
References
[1] Friedrich et al. (2000): Physics Letters A 271, p. 217-222Extracting model equations from experimental data- Parameters:
x (numpy.ndarray) – the time series to calculate the feature of
param (list) – contains dictionaries {“m”: x, “r”: y, “coeff”: z} with x being positive integer, the order of polynomial to fit for estimating fixed points of dynamics, y positive float, the number of quantiles to use for averaging and finally z, a positive integer corresponding to the returned coefficient
- Returns:
the different feature values
- Return type:
List[Tuple[str, float]]
This function is of type: combiner
- tsfresh.feature_extraction.feature_calculators.has_duplicate(x)[source]
Checks if any value in x occurs more than once
- Parameters:
x (numpy.ndarray) – the time series to calculate the feature of
- Returns:
the value of this feature
- Return type:
bool
This function is of type: simple
- tsfresh.feature_extraction.feature_calculators.has_duplicate_max(x)[source]
Checks if the maximum value of x is observed more than once
- Parameters:
x (numpy.ndarray) – the time series to calculate the feature of
- Returns:
the value of this feature
- Return type:
bool
This function is of type: simple
- tsfresh.feature_extraction.feature_calculators.has_duplicate_min(x)[source]
Checks if the minimal value of x is observed more than once
- Parameters:
x (numpy.ndarray) – the time series to calculate the feature of
- Returns:
the value of this feature
- Return type:
bool
This function is of type: simple
- tsfresh.feature_extraction.feature_calculators.index_mass_quantile(x, param)[source]
Calculates the relative index i of time series x where q% of the mass of x lies left of i. For example for q = 50% this feature calculator will return the mass center of the time series.
- Parameters:
x (numpy.ndarray) – the time series to calculate the feature of
param (list) – contains dictionaries {“q”: x} with x float
- Returns:
the different feature values
- Return type:
List[Tuple[str, float]]
This function is of type: combiner
- tsfresh.feature_extraction.feature_calculators.kurtosis(x)[source]
Returns the kurtosis of x (calculated with the adjusted Fisher-Pearson standardized moment coefficient G2).
- Parameters:
x (numpy.ndarray) – the time series to calculate the feature of
- Returns:
the value of this feature
- Return type:
float
This function is of type: simple
- tsfresh.feature_extraction.feature_calculators.large_standard_deviation(x, r)[source]
Does time series have large standard deviation?
Boolean variable denoting if the standard dev of x is higher than ‘r’ times the range = difference between max and min of x. Hence it checks if

According to a rule of the thumb, the standard deviation should be a forth of the range of the values.
- Parameters:
x (numpy.ndarray) – the time series to calculate the feature of
r (float) – the percentage of the range to compare with
- Returns:
the value of this feature
- Return type:
bool
This function is of type: simple
- tsfresh.feature_extraction.feature_calculators.last_location_of_maximum(x)[source]
Returns the relative last location of the maximum value of x. The position is calculated relatively to the length of x.
- Parameters:
x (numpy.ndarray) – the time series to calculate the feature of
- Returns:
the value of this feature
- Return type:
float
This function is of type: simple
- tsfresh.feature_extraction.feature_calculators.last_location_of_minimum(x)[source]
Returns the last location of the minimal value of x. The position is calculated relatively to the length of x.
- Parameters:
x (numpy.ndarray) – the time series to calculate the feature of
- Returns:
the value of this feature
- Return type:
float
This function is of type: simple
- tsfresh.feature_extraction.feature_calculators.lempel_ziv_complexity(x, bins)[source]
Calculate a complexity estimate based on the Lempel-Ziv compression algorithm.
The complexity is defined as the number of dictionary entries (or sub-words) needed to encode the time series when viewed from left to right. For this, the time series is first binned into the given number of bins. Then it is converted into sub-words with different prefixes. The number of sub-words needed for this divided by the length of the time series is the complexity estimate.
For example, if the time series (after binning in only 2 bins) would look like “100111”, the different sub-words would be 1, 0, 01 and 11 and therefore the result is 4/6 = 0.66.
Ref: https://github.com/Naereen/Lempel-Ziv_Complexity/blob/master/src/lempel_ziv_complexity.py
This function is of type: simple
- tsfresh.feature_extraction.feature_calculators.length(x)[source]
Returns the length of x
- Parameters:
x (numpy.ndarray) – the time series to calculate the feature of
- Returns:
the value of this feature
- Return type:
int
This function is of type: simple
- tsfresh.feature_extraction.feature_calculators.linear_trend(x, param)[source]
Calculate a linear least-squares regression for the values of the time series versus the sequence from 0 to length of the time series minus one. This feature assumes the signal to be uniformly sampled. It will not use the time stamps to fit the model. The parameters control which of the characteristics are returned.
Possible extracted attributes are “pvalue”, “rvalue”, “intercept”, “slope”, “stderr”, see the documentation of linregress for more information.
- Parameters:
x (numpy.ndarray) – the time series to calculate the feature of
param (list) – contains dictionaries {“attr”: x} with x an string, the attribute name of the regression model
- Returns:
the different feature values
- Return type:
List[Tuple[str, float]]
This function is of type: combiner
- tsfresh.feature_extraction.feature_calculators.linear_trend_timewise(x, param)[source]
Calculate a linear least-squares regression for the values of the time series versus the sequence from 0 to length of the time series minus one. This feature uses the index of the time series to fit the model, which must be of a datetime dtype. The parameters control which of the characteristics are returned.
Possible extracted attributes are “pvalue”, “rvalue”, “intercept”, “slope”, “stderr”, see the documentation of linregress for more information.
- Parameters:
x (pandas.Series) – the time series to calculate the feature of. The index must be datetime.
param (list) – contains dictionaries {“attr”: x} with x an string, the attribute name of the regression model
- Returns:
the different feature values
- Return type:
List[Tuple[str, float]]
This function is of type: combiner
- tsfresh.feature_extraction.feature_calculators.longest_strike_above_mean(x)[source]
Returns the length of the longest consecutive subsequence in x that is bigger than the mean of x
- Parameters:
x (numpy.ndarray) – the time series to calculate the feature of
- Returns:
the value of this feature
- Return type:
float
This function is of type: simple
- tsfresh.feature_extraction.feature_calculators.longest_strike_below_mean(x)[source]
Returns the length of the longest consecutive subsequence in x that is smaller than the mean of x
- Parameters:
x (numpy.ndarray) – the time series to calculate the feature of
- Returns:
the value of this feature
- Return type:
float
This function is of type: simple
- tsfresh.feature_extraction.feature_calculators.matrix_profile(x, param)[source]
Calculates the 1-D Matrix Profile[1] and returns Tukey’s Five Number Set plus the mean of that Matrix Profile.
This feature is not supported anymore, since matrixprofile does not up to date with latest Python releases. To use it, you can install the extra with pip install tsfresh[matrixprofile].
References
[1] Yeh et.al (2016), IEEE ICDM- Parameters:
x (numpy.ndarray) – the time series to calculate the feature of
param (list) – contains dictionaries {“sample_pct”: x, “threshold”: y, “feature”: z} with sample_pct and threshold being parameters of the matrixprofile package https://matrixprofile.docs.matrixprofile.org/api.html#matrixprofile-compute and feature being one of “min”, “max”, “mean”, “median”, “25”, “75” and decides which feature of the matrix profile to extract
- Returns:
the different feature values
- Return type:
List[Tuple[str, float]]
This function is of type: combiner
- tsfresh.feature_extraction.feature_calculators.max_langevin_fixed_point(x, r, m)[source]
Largest fixed point of dynamics :math:argmax_x {h(x)=0}` estimated from polynomial
,
which has been fitted to the deterministic dynamics of Langevin model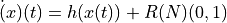
as described by
Friedrich et al. (2000): Physics Letters A 271, p. 217-222 Extracting model equations from experimental data
For short time-series this method is highly dependent on the parameters.
- Parameters:
x (numpy.ndarray) – the time series to calculate the feature of
m (int) – order of polynomial to fit for estimating fixed points of dynamics
r (float) – number of quantiles to use for averaging
- Returns:
Largest fixed point of deterministic dynamics
- Return type:
float
This function is of type: simple
- tsfresh.feature_extraction.feature_calculators.maximum(x)[source]
Calculates the highest value of the time series x.
- Parameters:
x (numpy.ndarray) – the time series to calculate the feature of
- Returns:
the value of this feature
- Return type:
float
This function is of type: simple
- tsfresh.feature_extraction.feature_calculators.mean(x)[source]
Returns the mean of x
- Parameters:
x (numpy.ndarray) – the time series to calculate the feature of
- Returns:
the value of this feature
- Return type:
float
This function is of type: simple
- tsfresh.feature_extraction.feature_calculators.mean_abs_change(x)[source]
Average over first differences.
Returns the mean over the absolute differences between subsequent time series values which is
- Parameters:
x (numpy.ndarray) – the time series to calculate the feature of
- Returns:
the value of this feature
- Return type:
float
This function is of type: simple
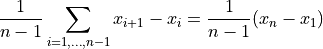
- tsfresh.feature_extraction.feature_calculators.mean_change(x)[source]
Average over time series differences.
Returns the mean over the differences between subsequent time series values which is
- Parameters:
x (numpy.ndarray) – the time series to calculate the feature of
- Returns:
the value of this feature
- Return type:
float
This function is of type: simple
- tsfresh.feature_extraction.feature_calculators.mean_n_absolute_max(x, number_of_maxima)[source]
Calculates the arithmetic mean of the n absolute maximum values of the time series.
- Parameters:
x (numpy.ndarray) – the time series to calculate the feature of
number_of_maxima (int) – the number of maxima, which should be considered
- Returns:
the value of this feature
- Return type:
float
This function is of type: simple
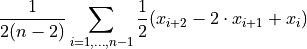
- tsfresh.feature_extraction.feature_calculators.mean_second_derivative_central(x)[source]
Returns the mean value of a central approximation of the second derivative
- Parameters:
x (numpy.ndarray) – the time series to calculate the feature of
- Returns:
the value of this feature
- Return type:
float
This function is of type: simple
- tsfresh.feature_extraction.feature_calculators.median(x)[source]
Returns the median of x
- Parameters:
x (numpy.ndarray) – the time series to calculate the feature of
- Returns:
the value of this feature
- Return type:
float
This function is of type: simple
- tsfresh.feature_extraction.feature_calculators.minimum(x)[source]
Calculates the lowest value of the time series x.
- Parameters:
x (numpy.ndarray) – the time series to calculate the feature of
- Returns:
the value of this feature
- Return type:
float
This function is of type: simple
- tsfresh.feature_extraction.feature_calculators.number_crossing_m(x, m)[source]
Calculates the number of crossings of x on m. A crossing is defined as two sequential values where the first value is lower than m and the next is greater, or vice-versa. If you set m to zero, you will get the number of zero crossings.
- Parameters:
x (numpy.ndarray) – the time series to calculate the feature of
m (float) – the threshold for the crossing
- Returns:
the value of this feature
- Return type:
int
This function is of type: simple
- tsfresh.feature_extraction.feature_calculators.number_cwt_peaks(x, n)[source]
Number of different peaks in x.
To estimate the numbers of peaks, x is smoothed by a ricker wavelet for widths ranging from 1 to n. This feature calculator returns the number of peaks that occur at enough width scales and with sufficiently high Signal-to-Noise-Ratio (SNR)
- Parameters:
x (numpy.ndarray) – the time series to calculate the feature of
n (int) – maximum width to consider
- Returns:
the value of this feature
- Return type:
int
This function is of type: simple
- tsfresh.feature_extraction.feature_calculators.number_peaks(x, n)[source]
Calculates the number of peaks of at least support n in the time series x. A peak of support n is defined as a subsequence of x where a value occurs, which is bigger than its n neighbours to the left and to the right.
Hence in the sequence
>>> x = [3, 0, 0, 4, 0, 0, 13]
4 is a peak of support 1 and 2 because in the subsequences
>>> [0, 4, 0]
>>> [0, 0, 4, 0, 0]
4 is still the highest value. Here, 4 is not a peak of support 3 because 13 is the 3th neighbour to the right of 4 and its bigger than 4.
- Parameters:
x (numpy.ndarray) – the time series to calculate the feature of
n (int) – the support of the peak
- Returns:
the value of this feature
- Return type:
float
This function is of type: simple
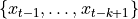
- tsfresh.feature_extraction.feature_calculators.partial_autocorrelation(x, param)[source]
Calculates the value of the partial autocorrelation function at the given lag.
The lag k partial autocorrelation of a time series
 equals the
partial correlation of
equals the
partial correlation of  and
and  , adjusted for the intermediate variables
 ([1]).
Following [2], it can be defined as
with (a)
 and (b)
  being AR(k-1) models that can be fitted by OLS. Be aware that in (a), the regression is done on past values to
predict whereas in (b), future values are used to calculate the past value .
It is said in [1] that “for an AR(p), the partial autocorrelations [
being AR(k-1) models that can be fitted by OLS. Be aware that in (a), the regression is done on past values to
predict whereas in (b), future values are used to calculate the past value .
It is said in [1] that “for an AR(p), the partial autocorrelations [  ] will be nonzero for k<=p
and zero for k>p.”
With this property, it is used to determine the lag of an AR-Process.
] will be nonzero for k<=p
and zero for k>p.”
With this property, it is used to determine the lag of an AR-Process.References
[1] Box, G. E., Jenkins, G. M., Reinsel, G. C., & Ljung, G. M. (2015).Time series analysis: forecasting and control. John Wiley & Sons.- Parameters:
x (numpy.ndarray) – the time series to calculate the feature of
param (list) – contains dictionaries {“lag”: val} with int val indicating the lag to be returned
- Returns:
the value of this feature
- Return type:
List[Tuple[str, float]]
This function is of type: combiner
- tsfresh.feature_extraction.feature_calculators.percentage_of_reoccurring_datapoints_to_all_datapoints(x)[source]
Returns the percentage of non-unique data points. Non-unique means that they are contained another time in the time series again.
# of data points occurring more than once / # of all data points
This means the ratio is normalized to the number of data points in the time series, in contrast to the percentage_of_reoccurring_values_to_all_values.
- Parameters:
x (numpy.ndarray) – the time series to calculate the feature of
- Returns:
the value of this feature
- Return type:
float
This function is of type: simple
- tsfresh.feature_extraction.feature_calculators.percentage_of_reoccurring_values_to_all_values(x)[source]
Returns the percentage of values that are present in the time series more than once.
len(different values occurring more than once) / len(different values)
This means the percentage is normalized to the number of unique values, in contrast to the percentage_of_reoccurring_datapoints_to_all_datapoints.
- Parameters:
x (numpy.ndarray) – the time series to calculate the feature of
- Returns:
the value of this feature
- Return type:
float
This function is of type: simple
- tsfresh.feature_extraction.feature_calculators.permutation_entropy(x, tau, dimension)[source]
Calculate the permutation entropy.
Three steps are needed for this:
chunk the data into sub-windows of length D starting every tau. Following the example from the reference, a vector
x = [4, 7, 9, 10, 6, 11, 3
with D = 3 and tau = 1 is turned into
- [[ 4, 7, 9],
[ 7, 9, 10], [ 9, 10, 6], [10, 6, 11], [ 6, 11, 3]]
replace each D-window by the permutation, that captures the ordinal ranking of the data. That gives
- [[0, 1, 2],
[0, 1, 2], [1, 2, 0], [1, 0, 2], [1, 2, 0]]
Now we just need to count the frequencies of every permutation and return their entropy (we use log_e and not log_2).
- Ref: https://www.aptech.com/blog/permutation-entropy/
Bandt, Christoph and Bernd Pompe. “Permutation entropy: a natural complexity measure for time series.” Physical review letters 88 17 (2002): 174102 .
This function is of type: simple
- tsfresh.feature_extraction.feature_calculators.quantile(x, q)[source]
Calculates the q quantile of x. This is the value of x greater than q% of the ordered values from x.
- Parameters:
x (numpy.ndarray) – the time series to calculate the feature of
q (float) – the quantile to calculate
- Returns:
the value of this feature
- Return type:
float
This function is of type: simple
- tsfresh.feature_extraction.feature_calculators.query_similarity_count(x, param)[source]
This feature calculator accepts an input query subsequence parameter, compares the query (under z-normalized Euclidean distance) to all subsequences within the time series, and returns a count of the number of times the query was found in the time series (within some predefined maximum distance threshold). Note that this feature will always return np.nan when no query subsequence is provided and so users will need to enable this feature themselves.
- Parameters:
x (numpy.ndarray) – the time series to calculate the feature of
param (list[dict]) – contains dictionaries {“query”: Q, “threshold”: thr, “normalize”: norm} with Q (numpy.ndarray), the query subsequence to compare the time series against. If Q is omitted then a value of zero is returned. Additionally, thr (float), the maximum z-normalized Euclidean distance threshold for which to increment the query similarity count. If thr is omitted then a default threshold of thr=0.0 is used, which corresponds to finding exact matches to Q. Finally, for non-normalized (i.e., without z-normalization) Euclidean set norm (bool) to `False.
- Return x:
the different feature values
- Return type:
List[Tuple[str, int | np.nan]]
This function is of type: combiner
- tsfresh.feature_extraction.feature_calculators.range_count(x, min, max)[source]
Count observed values within the interval [min, max).
- Parameters:
x (numpy.ndarray) – the time series to calculate the feature of
min (int or float) – the inclusive lower bound of the range
max (int or float) – the exclusive upper bound of the range
- Returns:
the count of values within the range
- Return type:
int
This function is of type: simple
- tsfresh.feature_extraction.feature_calculators.ratio_beyond_r_sigma(x, r)[source]
Ratio of values that are more than r * std(x) (so r times sigma) away from the mean of x.
- Parameters:
x (iterable) – the time series to calculate the feature of
r (float) – the ratio to compare with
- Returns:
the value of this feature
- Return type:
float
This function is of type: simple
- tsfresh.feature_extraction.feature_calculators.ratio_value_number_to_time_series_length(x)[source]
Returns a factor which is 1 if all values in the time series occur only once, and below one if this is not the case. In principle, it just returns
# unique values / # values
- Parameters:
x (numpy.ndarray) – the time series to calculate the feature of
- Returns:
the value of this feature
- Return type:
float
This function is of type: simple
- tsfresh.feature_extraction.feature_calculators.root_mean_square(x)[source]
Returns the root mean square (rms) of the time series.
- Parameters:
x (numpy.ndarray) – the time series to calculate the feature of
- Returns:
the value of this feature
- Return type:
float
This function is of type: simple
- tsfresh.feature_extraction.feature_calculators.sample_entropy(x)[source]
Calculate and return sample entropy of x.
References
- Parameters:
x (numpy.ndarray) – the time series to calculate the feature of
- Returns:
the value of this feature
- Return type:
float
This function is of type: simple
- tsfresh.feature_extraction.feature_calculators.set_property(key, value)[source]
This method returns a decorator that sets the property key of the function to value
- tsfresh.feature_extraction.feature_calculators.skewness(x)[source]
Returns the sample skewness of x (calculated with the adjusted Fisher-Pearson standardized moment coefficient G1).
- Parameters:
x (numpy.ndarray) – the time series to calculate the feature of
- Returns:
the value of this feature
- Return type:
float
This function is of type: simple
- tsfresh.feature_extraction.feature_calculators.spkt_welch_density(x, param)[source]
This feature calculator estimates the cross power spectral density of the time series x at different frequencies. To do so, the time series is first shifted from the time domain to the frequency domain.
The feature calculators returns the power spectrum of the different frequencies.
- Parameters:
x (numpy.ndarray) – the time series to calculate the feature of
param (list) – contains dictionaries {“coeff”: x} with x int
- Returns:
the different feature values
- Return type:
Iterator[Tuple[str, float]]
This function is of type: combiner
- tsfresh.feature_extraction.feature_calculators.standard_deviation(x)[source]
Returns the standard deviation of x
- Parameters:
x (numpy.ndarray) – the time series to calculate the feature of
- Returns:
the value of this feature
- Return type:
float
This function is of type: simple
- tsfresh.feature_extraction.feature_calculators.sum_of_reoccurring_data_points(x)[source]
Returns the sum of all data points, that are present in the time series more than once.
For example
sum_of_reoccurring_data_points([2, 2, 2, 2, 1]) = 8
as 2 is a reoccurring value, so all 2’s are summed up.
This is in contrast to
sum_of_reoccurring_values, where each reoccuring value is only counted once.- Parameters:
x (numpy.ndarray) – the time series to calculate the feature of
- Returns:
the value of this feature
- Return type:
float
This function is of type: simple
- tsfresh.feature_extraction.feature_calculators.sum_of_reoccurring_values(x)[source]
Returns the sum of all values, that are present in the time series more than once.
For example
sum_of_reoccurring_values([2, 2, 2, 2, 1]) = 2
as 2 is a reoccurring value, so it is summed up with all other reoccuring values (there is none), so the result is 2.
This is in contrast to
sum_of_reoccurring_data_points, where each reoccuring value is only counted as often as it is present in the data.- Parameters:
x (numpy.ndarray) – the time series to calculate the feature of
- Returns:
the value of this feature
- Return type:
float
This function is of type: simple
- tsfresh.feature_extraction.feature_calculators.sum_values(x)[source]
Calculates the sum over the time series values
- Parameters:
x (numpy.ndarray) – the time series to calculate the feature of
- Returns:
the value of this feature
- Return type:
float
This function is of type: simple
- tsfresh.feature_extraction.feature_calculators.symmetry_looking(x, param)[source]
Boolean variable denoting if the distribution of x looks symmetric. This is the case if

- Parameters:
x (numpy.ndarray) – the time series to calculate the feature of
param (list) – contains dictionaries {“r”: x} with x (float) is the percentage of the range to compare with
- Returns:
the value of this feature
- Return type:
List[Tuple[str, bool]]
This function is of type: combiner
- tsfresh.feature_extraction.feature_calculators.time_reversal_asymmetry_statistic(x, lag)[source]
Returns the time reversal asymmetry statistic.
This function calculates the value of
which is
![\mathbb{E}[L^2(X)^2 \cdot L(X) - L(X) \cdot X^2]](../_images/math/bfe1cfc74e3ffaf69103b4b966271aa22b14ece0.png)
where
is the mean and is the lag operator. It was proposed in [1] as a
promising feature to extract from time series.References
[1] Fulcher, B.D., Jones, N.S. (2014).Highly comparative feature-based time-series classification.Knowledge and Data Engineering, IEEE Transactions on 26, 3026–3037.- Parameters:
x (numpy.ndarray) – the time series to calculate the feature of
lag (int) – the lag that should be used in the calculation of the feature
- Returns:
the value of this feature
- Return type:
float
This function is of type: simple
- tsfresh.feature_extraction.feature_calculators.value_count(x, value)[source]
Count occurrences of value in time series x.
- Parameters:
x (numpy.ndarray) – the time series to calculate the feature of
value (int or float) – the value to be counted
- Returns:
the count
- Return type:
int
This function is of type: simple
- tsfresh.feature_extraction.feature_calculators.variance(x)[source]
Returns the variance of x
- Parameters:
x (numpy.ndarray) – the time series to calculate the feature of
- Returns:
the value of this feature
- Return type:
float
This function is of type: simple
- tsfresh.feature_extraction.feature_calculators.variance_larger_than_standard_deviation(x)[source]
Is variance higher than the standard deviation?
Boolean variable denoting if the variance of x is greater than its standard deviation. Is equal to variance of x being larger than 1
- Parameters:
x (numpy.ndarray) – the time series to calculate the feature of
- Returns:
the value of this feature
- Return type:
bool
This function is of type: simple
- tsfresh.feature_extraction.feature_calculators.variation_coefficient(x)[source]
Returns the variation coefficient (standard error / mean, give relative value of variation around mean) of x.
- Parameters:
x (numpy.ndarray) – the time series to calculate the feature of
- Returns:
the value of this feature
- Return type:
float
This function is of type: simple
tsfresh.feature_extraction.settings module
This file contains methods/objects for controlling which features will be extracted when calling extract_features. For the naming of the features, see Feature Calculator Naming.
- class tsfresh.feature_extraction.settings.ComprehensiveFCParameters[source]
Bases:
PickableSettingsCreate a new ComprehensiveFCParameters instance. You have to pass this instance to the extract_feature instance.
It is basically a dictionary (and also based on one), which is a mapping from string (the same names that are in the feature_calculators.py file) to a list of dictionary of parameters, which should be used when the function with this name is called.
Only those strings (function names), that are keys in this dictionary, will be later used to extract features - so whenever you delete a key from this dict, you disable the calculation of this feature.
You can use the settings object with
>>> from tsfresh.feature_extraction import extract_features, ComprehensiveFCParameters
>>> extract_features(df, default_fc_parameters=ComprehensiveFCParameters())
to extract all features (which is the default nevertheless) or you change the ComprehensiveFCParameters object to other types (see below).
- class tsfresh.feature_extraction.settings.EfficientFCParameters[source]
Bases:
ComprehensiveFCParametersThis class is a child class of the ComprehensiveFCParameters class and has the same functionality as its base class.
The only difference is, that the features with high computational costs are not calculated. Those are denoted by the attribute “high_comp_cost”.
You should use this object when calling the extract function, like so:
>>> from tsfresh.feature_extraction import extract_features, EfficientFCParameters
>>> extract_features(df, default_fc_parameters=EfficientFCParameters())
- class tsfresh.feature_extraction.settings.IndexBasedFCParameters[source]
Bases:
ComprehensiveFCParametersThis class is a child class of the ComprehensiveFCParameters class and has the same functionality as its base class.
The only difference is that only the features that require a pd.Series as an input are included. Those have an attribute “input” with value “pd.Series”.
- class tsfresh.feature_extraction.settings.MinimalFCParameters[source]
Bases:
ComprehensiveFCParametersThis class is a child class of the ComprehensiveFCParameters class and has the same functionality as its base class. The only difference is, that most of the feature calculators are disabled and only a small subset of calculators will be calculated at all. Those are denoted by an attribute called “minimal”.
Use this class for quick tests of your setup before calculating all features which could take some time depending of your data set size.
You should use this object when calling the extract function, like so:
>>> from tsfresh.feature_extraction import extract_features, MinimalFCParameters
>>> extract_features(df, default_fc_parameters=MinimalFCParameters())
- class tsfresh.feature_extraction.settings.PickableSettings(dict=None, /, **kwargs)[source]
Bases:
UserDictBase object for all settings, which is a pickable dict. For user-specified functions, the settings dictionary might include functions as a key. These functions unfortunately can not easily be transported to workers in multiprocessing or multi-cloud setups, as they are not pickable by default. Therefore, we change the pickle-behavior of this class and use cloudpickle for pickling and unpickling the keys of the dictionary, before pickling the full object. cloudpickle is able to pickle much more functions than pickle can and pickle will only see the already encoded keys (not the raw functions).
- class tsfresh.feature_extraction.settings.TimeBasedFCParameters[source]
Bases:
ComprehensiveFCParametersThis class is a child class of the ComprehensiveFCParameters class and has the same functionality as its base class.
The only difference is, that only the features that require a DatetimeIndex are included. Those have an attribute “index_type” with value pd.DatetimeIndex.
- tsfresh.feature_extraction.settings.from_columns(columns, columns_to_ignore=None)[source]
Creates a mapping from kind names to fc_parameters objects (which are itself mappings from feature calculators to settings) to extract only the features contained in the columns. To do so, for every feature name in columns this method
split the column name into col, feature, params part
decide which feature we are dealing with (aggregate with/without params or apply)
add it to the new name_to_function dict
set up the params
- Parameters:
columns (list of str) – containing the feature names
columns_to_ignore (list of str) – columns which do not contain tsfresh feature names
- Returns:
The kind_to_fc_parameters object ready to be used in the extract_features function.
- Return type:
dict
- tsfresh.feature_extraction.settings.include_function(func, exclusion_attr='input_type')[source]
Helper function for selecting specific subset of functions subject to an exclusion attribute and the availability of optional dependencies.
- Parameters:
func (object) – function to be tested for inclusion
exclusion_attr (str) – function attribute qualifying as exclusion criterion
- Returns:
Boolean indicating if the specific function matches the inclusion criteria.
- Return type:
bool
Module contents
The tsfresh.feature_extraction module contains methods to extract the features from the time series